The chi-square test isn't some obscure math trick for statisticians. It's a method used in many fields—marketing, research, and AI—to check whether the differences in your data are real or just random. At its core, this test helps compare actual outcomes with what you'd expect if everything were equal.
For example, if customer behavior shifts across age groups or regions, the chi-square test helps verify whether that shift is statistically meaningful. It's straightforward, runs on counts, and doesn't require complex math to use or understand.
What Is the Chi-Square Test?
The chi-square test (written as χ² test) is used to measure how observed data compares to expected data under the assumption that there’s no relationship between the variables. It applies to categorical variables—things that fall into distinct groups, like age brackets, device types, or survey responses.
There are two common forms:
Chi-Square Test for Independence: Used when you want to see if two variables are related, such as whether gender and product preference are connected.
Chi-Square Goodness-of-Fit Test: Used to check whether the distribution of a single variable fits an expected pattern. For instance, if you expect equal votes for four different products but suspect otherwise, this test can help confirm that.
The test calculates a statistic using this formula:
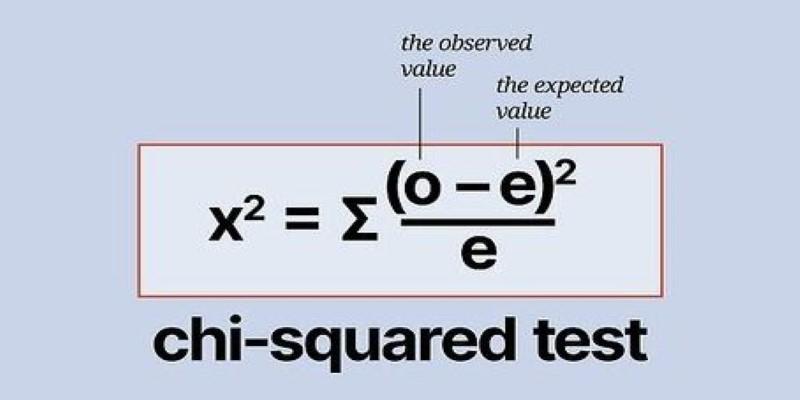
χ² = Σ[(O - E)² / E]
Where O is the observed frequency and E is the expected frequency. The result tells you how far your actual data is from the expected pattern. A larger value suggests the difference is unlikely due to chance.
To make sense of that value, you compare it to a chi-square distribution table based on degrees of freedom (determined by the number of categories involved) and a chosen confidence level, commonly 95%.
How It Works: An Example
Imagine a survey collected responses about preferred fruit flavors on three different days of the week. The flavors were mango, apple, and orange. The business wants to check whether preferences shift by day. If no shift exists, you'd expect each flavor to have a similar share across the days.
Using the chi-square test for independence, the observed counts for each flavor across the three days are entered into a contingency table. Then, expected counts are calculated assuming no preference change across the week. The test statistic reveals how much the observed data strays from that assumption.
The more it deviates, the more reason to think preferences may be influenced by the day. If the difference exceeds a certain threshold, the result is considered statistically significant.
The same logic applies in many settings. In customer feedback, for instance, if a service receives differing satisfaction scores across locations, the chi-square test can show whether those differences are significant or just random variation.
It works best with simple count data and doesn’t rely on assumptions like normal distribution, making it suitable even when sample sizes are moderate.
Common Uses of the Chi-Square Test
The chi-square test has a wide range of applications beyond academic studies. In business, it helps compare behavior across different customer segments. A company could use it to assess whether users from various regions respond differently to a product offer. If a large difference is found, the team can adjust messaging or design by region.

In healthcare, it helps assess links between treatment groups and recovery outcomes. Suppose a clinic wants to know if recovery rates differ between two therapies. If the chi-square result is significant, they might investigate why one therapy performs better.
In AI and machine learning, it’s used in fairness audits. For example, after deploying a model, a team may want to know whether it performs equally well across demographic groups. By comparing error rates across categories, the chi-square test helps flag possible biases.
It’s also used during feature selection in models. In classification problems, chi-square can evaluate the strength of association between input features and the target. This helps in choosing the most relevant variables and discarding the weaker ones, streamlining model training and reducing complexity.
Limits, Assumptions, and Things to Watch For
While the chi-square test is practical and easy to apply, it does come with a few conditions. First, the data must be in frequency form—raw counts—not percentages or continuous values, such as income or height.
The test also assumes that each expected frequency is not too small. A common guideline is that all expected counts should be at least 5. If this condition isn't met, results might be unreliable. In such cases, either combining smaller categories or switching to an exact test, such as Fisher's, can help.
Another key requirement is independence. Each observation must be counted once and must not fall into multiple categories. Repeated measures or overlapping groupings can break this assumption and lead to misleading results.
Also, while the test shows whether a relationship exists, it doesn't explain the nature of that relationship. A statistically significant result doesn't tell you why two variables are connected; it just says they likely are.
Lastly, it's not ideal for datasets with too many empty or sparsely populated categories, as the math becomes unstable when dividing by very small expected values.
Even with these limitations, the chi-square test remains a reliable go-to for quick analysis when dealing with categorical data and count-based comparisons.
Conclusion
The chi-square test is a straightforward, useful way to check whether categories in your data behave independently or have a real connection. It doesn’t require advanced math, just simple counts and a bit of comparison between what you expected and what actually happened. Whether you’re testing customer preferences, evaluating a campaign, or auditing an AI model, the chi-square test helps bring clarity to categorical data. While it has some assumptions and isn’t perfect for every scenario, it works well in most day-to-day cases. If your data raises questions, this test offers a simple way to look for answers.