Linear regression is one of the most straightforward approaches in machine learning, often taught early but used widely in professional work. It predicts numerical outcomes based on input variables using a simple equation. Whether estimating housing prices or sales forecasts, its core idea is easy to grasp: find the line that best fits the data. Although more advanced algorithms exist, linear regression remains useful because it’s fast, easy to interpret, and often surprisingly accurate when the relationships in the data are relatively clear.
What Is Linear Regression?
Linear regression is a type of supervised learning algorithm used to predict continuous numerical values. It builds a model by identifying the relationship between an output (the target variable) and one or more input features (also called predictors or independent variables). The term "linear" refers to the assumption that this relationship is a straight-line connection, represented in the form of a mathematical equation.
In its simplest version—simple linear regression, there is just one feature. For instance, predicting a car’s resale price based solely on its age. But in most practical cases, we deal with multiple linear regression, where several features contribute to the prediction, like mileage, brand, and engine size for the same car example.
The standard equation looks like this:
y = β₀ + β₁x₁ + β₂x₂ + ... + βₙxₙ + ε
Here, y is the target variable, β₀ is the intercept, and the β₁...βₙ values are the coefficients that show how much influence each input has on the output. ε accounts for the error or noise in the predictions.
The model assumes a consistent influence from each input feature. This allows predictions for unseen data, as long as the relationships stay similar to what was observed during training.
How the Model Learns?
To make accurate predictions, the model must learn the right values for its coefficients. It does this by reducing the difference between the actual values and what it predicts. This difference is measured through something called a loss function, most commonly the Mean Squared Error (MSE). It squares the residuals (the gaps between predicted and real values) and averages them.
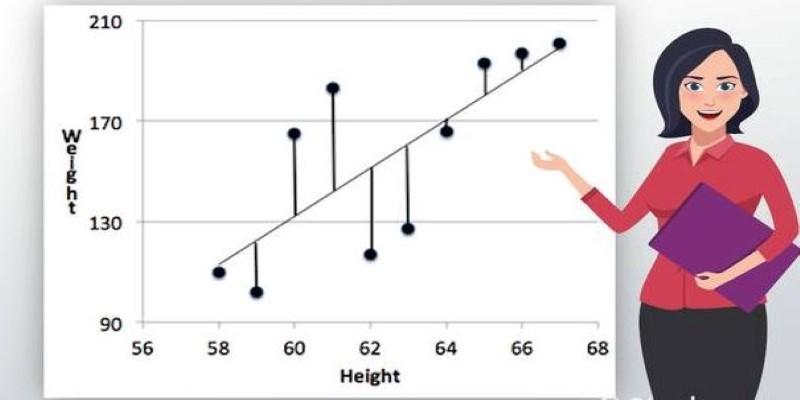
The idea is simple: if the predicted values are way off, the squared errors will be large. The model adjusts the coefficients to reduce these errors. This process is called fitting the model.
For smaller datasets or simpler problems, matrix operations can be used to directly compute the best coefficients. In larger or more complex problems, especially with many features, a technique called gradient descent is often used. This is an iterative approach where the model slowly updates its coefficients in the direction that reduces the loss.
The learning process relies on finding a minimum in the error surface—a spot where further adjustments won’t meaningfully improve predictions. Once the coefficients stabilize, the model is ready to make predictions on new data.
Assumptions, Limitations, and Diagnostics
Linear regression works under a few key assumptions. If these aren't reasonably met, predictions may be off or misleading.
Linearity is the most fundamental assumption. The model expects the relationship between inputs and output to be a straight line. If the actual pattern is curved or varies in other ways, the model won’t capture it well.
Independence of observations is also critical. Each data point should be unrelated to the others. This assumption often breaks down in time series data, where today’s value influences tomorrow’s.
Another assumption is homoscedasticity, which means the residuals—the differences between predicted and actual values—should have a consistent spread across all levels of the input variables. If this isn’t true, it’s called heteroscedasticity, and it can lead to unreliable predictions.
Multicollinearity is a concern in multiple linear regression. If two or more input features are highly correlated, the model may struggle to assign distinct influence to each. This can make the coefficients unstable and hard to interpret.
Finally, the model assumes normally distributed residuals, especially if you plan to perform statistical tests or create confidence intervals. This doesn’t always affect prediction performance, but it matters for understanding the model's behavior.
To verify these assumptions, residual plots, correlation matrices, and statistical tests like the Durbin-Watson test or Variance Inflation Factor (VIF) are often used.
Real-World Applications and When to Use Them
Linear regression is widely used because it's fast, interpretable, and often performs well with structured data. In finance, it can model trends, such as revenue based on ad spend. In healthcare, it’s used to predict blood pressure from age, weight, and medical history. In marketing, it helps assess campaign performance using conversion data.
Its transparency makes it especially useful when the results need to be explained to others. Each coefficient tells you how much a variable contributes to the outcome, which is useful for understanding cause and effect. For example, if the model finds that each additional year of experience adds $5,000 to a salary estimate, that insight can be communicated and trusted.
However, it has limits. Linear regression can’t handle complex patterns or non-linear relationships unless the inputs are transformed. If the data includes interactions, thresholds, or cycles, tree-based models or neural networks might outperform it.
Still, it remains a common first choice in machine learning pipelines. Even when used as a baseline, it helps you understand whether fancier algorithms are actually worth the added complexity.
Conclusion
Linear regression is a foundational part of machine learning. It’s not designed for every problem, but when the relationship between inputs and outputs is straightforward, it does the job well. Its simplicity, speed, and interpretability make it valuable for both beginners and professionals. It teaches core principles like loss functions, model evaluation, and overfitting. And in many situations, it performs better than expected. Knowing when and how to use linear regression means you’ve got a reliable tool for making informed predictions—without overcomplicating things.